Chart patterns in stocks are visual representations of price movements over time. They can provide insights into potential future price movements and help traders make informed decisions. Some common chart patterns include:
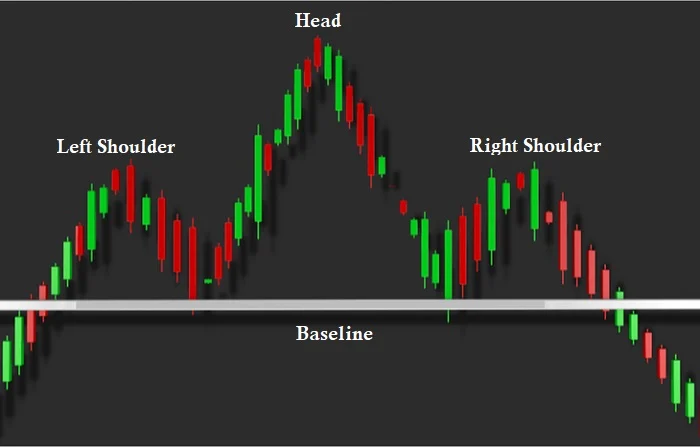
Head and Shoulders: This pattern consists of three peaks, with the middle peak (the head) being higher than the other two (the shoulders). It suggests a potential trend reversal from bullish to bearish.
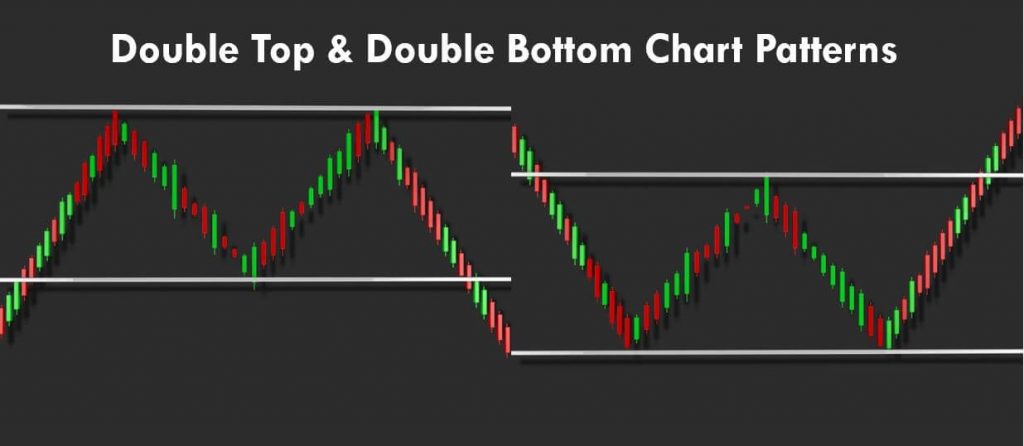
Double Top/Bottom: This pattern occurs when the price reaches a high (double top) or a low (double bottom) twice before reversing. It indicates a possible trend reversal.
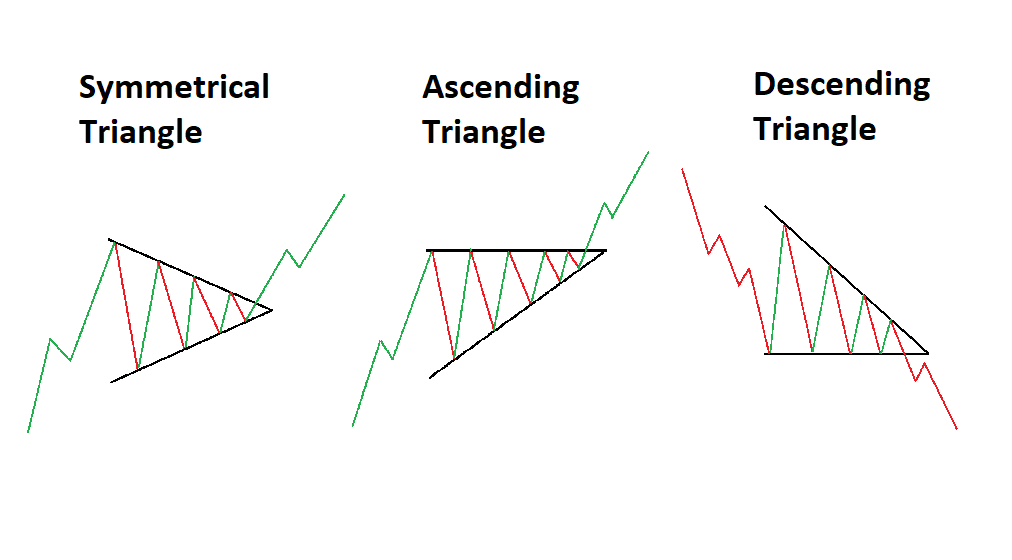
Triangle: Triangles can be ascending, descending, or symmetrical. They represent a period of consolidation before a potential breakout in either direction.
Cup and Handle: This pattern resembles a cup with a handle. It suggests a bullish continuation, with the handle representing a brief consolidation before the price resumes its upward trend.

Flag and Pennant: These patterns are characterized by a sharp price movement (flagpole) followed by a period of consolidation (flag or pennant). They often precede a continuation of the previous trend.

“Remember, chart patterns are not foolproof indicators and should be used in conjunction with other technical analysis tools and fundamental analysis for more accurate predictions.”
There are several types of candlestick patterns that traders commonly use for technical analysis. Here are some of the most popular and effective candlestick patterns for trading:
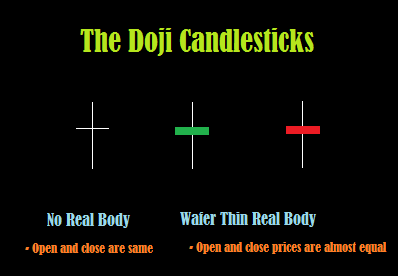
Doji: A doji occurs when the opening and closing prices are very close or equal, resulting in a small or no real body. It suggests indecision in the market and can signal a potential trend reversal.
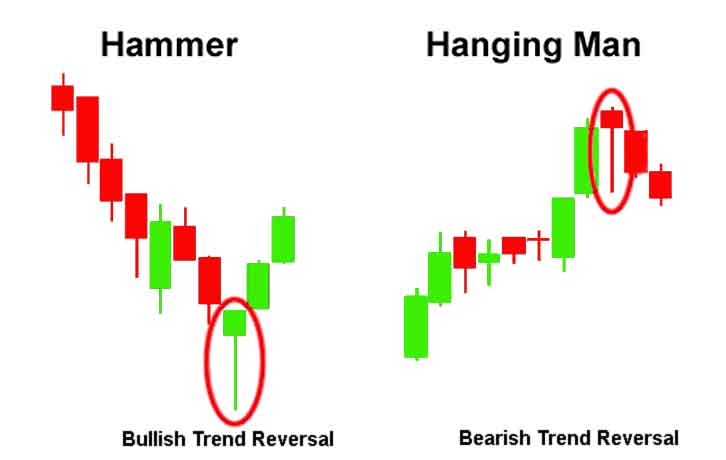
Hammer and Hanging Man: These patterns indicate potential trend reversals. A hammer forms at the bottom of a downtrend, while a hanging man forms at the top of an uptrend.
Morning Star and Evening Star: These patterns are formed by three candles and indicate potential trend reversals. The morning star forms at the bottom of a downtrend, while the evening star forms at the top of an uptrend.

Shooting Star and Inverted Hammer: These patterns are similar to the hammer and hanging man but have a small real body and a long upper shadow. A shooting star forms at the top of an uptrend, suggesting a potential reversal, while an inverted hammer forms at the bottom of a downtrend, indicating a potential reversal.

“Remember, candlestick patterns should not be used in isolation but should be combined with other technical indicators and analysis techniques for more accurate trading decisions.”